Vacasa
Executive Dashboard
We created an Executive Dashboard for Vacasa to visualize their critical Key Performance Indicators (KPI) across the entire company. Vacasa uses Looker for business intelligence, dashboards & reporting. Looker is connected to an Amazon Redshift database that contains information flowing in from multiple data sources. The goal of the Executive Dashboard was to identify those key metrics that were most critical to monitor the business, and display them within a polished, branded web application that is functional, informative and engaging. Having this information centrally available in one location helps to facilitate better communication within Vacasa as business teams focus on the same things, improving business results and driving positive change.
The app protects all data behind a login, so no live link available.


Technologies Used
- Front-end
- React
- D3.js - Creating charts integrated with React
- Redux
- Bootstrap - Charts are a mix of responsive HTML/SVG to work on mobile
- API
- Python
- Flask
- Using SAML for integration with Vacasa Single Sign On
- Integration with the Looker API
- DevOps/Hosting
- Redis for a catching layer in front of Looker API
- Dockerfiles created to easily integrate into client's architecture
- Test site hosted in Amazon Web Services using Elastic Container Registry (ECR) and Elastic Container Service (ECS)
About the Client (Vacasa)

Vacasa is the largest vacation rental management company in the U.S., Vacasa uses industry-leading technology to better care for guests and maximize financial returns for vacation homeowners. In support of its global operations, Vacasa has physical offices around the world with a growing presence here in Boise.
"It's always a pleasure working with a client that cares about the details that go into a product, yet is practical enough to know what it takes to deliver great software. It's also very impressive to realize how many metrics drive the company forward and their collective buy-in to be a data-driven organization."
— Jeremy Zerr, Founder, Zerrtech
In the Client's Words
"Working with Jeremy and Zerrtech has been incredibly positive. After a brief POC we were convinced they had the right combination of communication skills, business understanding, and technical expertise to help take our project over the finish line. I would use them again in a heartbeat!"
— Keith Smith, Director of Business Intelligence, Vacasa
Project Role
Our roles in this project included:
- Software Architecture and Design
- Coding all responsive HTML5, CSS, Javascript
- Creating all D3.js SVG charts and integrating with React
- Creating Dockerfile to be able to host in client's AWS
- Creating a system to email dashboard charts to users via an automated, background process
Feature Summary
Due to the sensitive nature of the KPIs and data, we can't show some of the screenshots. Here is a high level summary of the Executive Dashboard features:
- Company metrics from the Looker API displayed in charts built using D3.js integrated with React + Redux
- Chart types include bullet charts, sparklines, streamgraphs, geographic data, bar charts, line charts.
- Nearly all charts include interactivity, including hover over tooltips and highlighting, dynamic color palette conforming to brand standards when appropriate, and some drill down details.
- Integrated with Vacasa Single Sign On for a seamless experience for Vacasa executives and employees, and protect all access to the underlying data
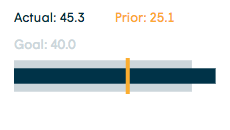
Bullet chart showing data when you hover.
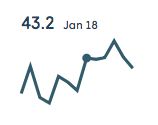
Sparkline chart showing data when you hover.
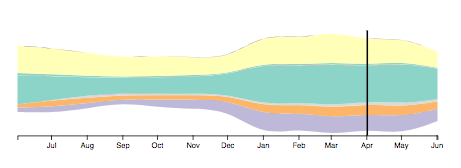
Streamgraph showing categories changing over time. There is a hover that shows when you select one of the categories of the chart, but leaving it out for privacy reasons.
Geographic data showing data for states.

Technology Details
React + D3.js was a great fit for this project. The combination of technologies made it simple to build reusable chart components and have them update to reflect changes fetched from the API. We used Redux to store the data to provide organization around the many API calls and data shapes. We enjoyed taking on the styling challenge of aligning groups of D3.js SVG visualizations in a responsive environment.
The Python + Flask API allowed us to simply handle the security requirements of integrating with a Single Sign On system using SAML.
We used Docker to create a self-contained project that would be easy to integrate into the client's existing AWS infrastructure. We used Docker compose to enable our local development environment to be as close as possible to the production environment.