

An executive dashboard for company-wide KPIs
An Executive Dashboard to visualize Vacasa's critical KPIs across the entire company, pulling from Looker and Redshift into a polished, branded, interactive web app.
“After a brief POC we were convinced they had the right combination of communication skills, business understanding, and technical expertise to take our project over the finish line.”
About Vacasa
Vacasa is the largest vacation rental management company in the U.S., using industry-leading technology to better care for guests and maximize financial returns for vacation homeowners. In support of its global operations, Vacasa has offices around the world, with a growing presence here in Boise.
Visit vacasa.com →Make critical metrics visible, engaging, and secure
Vacasa uses Looker for business intelligence, connected to an Amazon Redshift database fed by multiple sources. The goal of the Executive Dashboard was to identify the metrics most critical to monitoring the business and display them in a polished, branded web application that's functional, informative, and engaging.
Having this information centrally available helps facilitate better communication within Vacasa as business teams focus on the same things: improving results and driving positive change. The app protects all data behind a login.
Charts that tell the story, behind SSO
Rich chart library
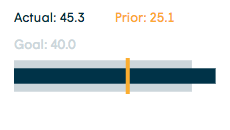
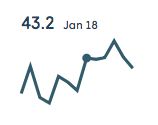
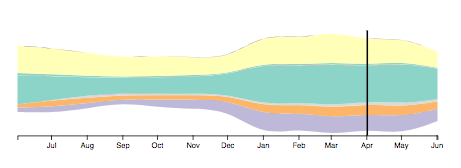
Bullet charts, sparklines, streamgraphs, geographic data, bar and line charts, all built with D3.js integrated with React + Redux.
Interactive by default
Hover tooltips and highlighting, a brand-conforming dynamic color palette, and drill-down details.
Single Sign On
Integrated with Vacasa SSO via SAML for a seamless experience and to protect all underlying data.
Automated email reports
A background process emails dashboard charts to users on a schedule.

Software architecture and design.
Coding all responsive HTML5, CSS, and JavaScript, and creating all D3.js SVG charts integrated with React.
Creating a Dockerfile to host within the client's AWS.
Building a system to email dashboard charts to users via an automated background process.
React + D3.js was a great fit. The combination made it simple to build reusable chart components that update as data is fetched from the API, with Redux organizing the many API calls and data shapes. The real challenge (and the fun) was aligning groups of D3.js SVG visualizations in a fully responsive layout.
A Python + Flask API let us cleanly handle the security requirements of integrating with a Single Sign On system over SAML.
Docker packaged the project so it dropped easily into the client's existing AWS infrastructure, with Docker Compose keeping local development as close as possible to production.
Have an idea on a deadline?
We turn ambitious ideas into shipped products, and leave your team able to run them.
Start a project